
Accueil
-
Blog & Actualités
-
Résolution, résilience et intégration : un cadre en forme de triangle d’or pour choisir entre les écrans industriels 1280×720, 1280×800 et 1920×1080
Résolution, résilience et intégration : un cadre en forme de triangle d’or pour choisir entre les écrans industriels 1280×720, 1280×800 et 1920×1080
2026-05-25
11:07
Résolution, résilience et intégration : un cadre en forme de triangle d’or pour choisir entre les écrans industriels 1280×720, 1280×800 et 1920×1080
Comment adapter la classe de résolution à l'environnement d'exploitation et à la pile d'intégration — avec les données d'ingénierie à l'appui
Par l'équipe technique de Kadi Display | www.kadidisplay.com
Pourquoi la résolution ne représente qu'un tiers de l'équation
Entrez dans n'importe quel salon de l'automatisation industrielle — SPS, Hannover Messe ou Automate — et vous entendrez des ingénieurs débattre des spécifications d'affichage comme si la résolution était le seul critère déterminant. 1280×720, 1280×800, 1920×1080 — ces chiffres sont brandis avec une assurance qui laisse entendre que la décision est simple. Ce qui est loin d'être le cas.
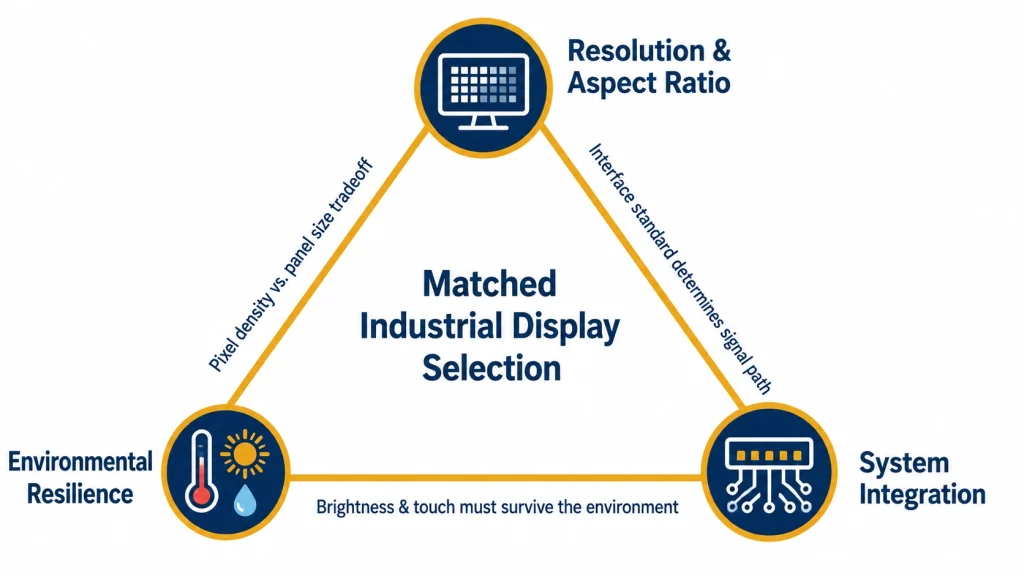
Choisir un écran uniquement en fonction de sa résolution, c'est comme choisir un camion en se basant uniquement sur sa puissance. Cela ne vous donne qu'une partie de l'histoire. Triangle d'or de la sélection d'écrans IHM industriels couvre trois facteurs véritablement interdépendants : résolution et format d'image, résilience environnementaleet compatibilité d'intégration du systèmeSi l'on sous-estime un seul aspect, on obtient un résultat impressionnant sur le papier, mais qui engendre des problèmes – problèmes de lisibilité, retards d'intégration ou défaillances prématurées sur le terrain – lors de déploiements réels.
Cet article examine chaque aspect du problème en utilisant les trois classes de résolution les plus couramment déployées dans le contrôle industriel actuel. Les données d'ingénierie sont précises. Le cadre de décision est pratique. L'objectif est le même pour tous les ingénieurs en approvisionnement et en conception : réussir du premier coup, avant la fermeture définitive du boîtier.
Coin 1 — Résolution et format d'image
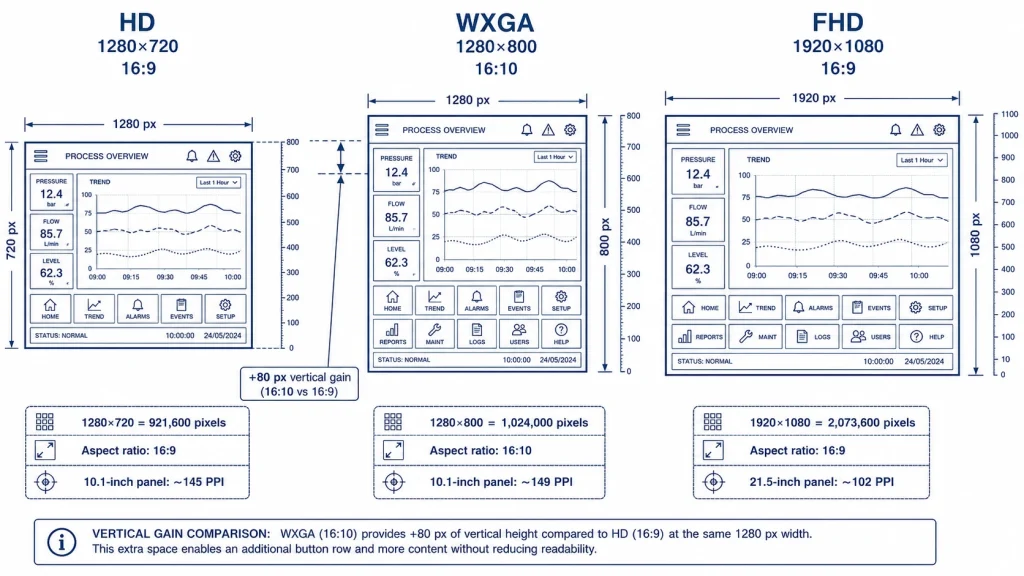
Les trois classes de résolution qui dominent actuellement les déploiements d'écrans industriels possèdent des identités géométriques distinctes. Ces différences géométriques influent non seulement sur la quantité d'informations affichables à l'écran, mais aussi sur la manière dont ces informations sont structurées pour l'opérateur.
1280×720 (16:9, HD) — La norme Embedded Field
À une résolution de 1280 × 720, le nombre total de pixels atteint environ 921 600 au format 16:9. Sur un écran de 10,1 pouces, cela correspond à une densité de pixels d'environ 149 ppp, largement suffisante pour les interfaces homme-machine (IHM) standard, les graphiques de tendances, les tableaux de bord d'alarmes et les interfaces de navigation. Le format 16:9 correspond parfaitement aux conventions d'affichage grand écran et est particulièrement adapté aux applications embarquées compactes là où l'espace horizontal compte plus que la profondeur verticale : terminaux opérateurs embarqués, interfaces homme-machine compactes à montage sur panneau, systèmes de kiosques et écrans pour machines agricoles.
Un avantage pratique souvent négligé : le format 16:9 est compatible nativement avec les conventions de signal HDMI et DisplayPort, réduisant ainsi le risque d’artefacts de mise à l’échelle lors de l’affichage depuis une plateforme hôte embarquée standard. Pour les applications où le matériel exécute Linux avec un pilote de mémoire tampon d’image standard, la résolution 1280 × 720 est souvent la plus facile à configurer correctement sans fichiers de synchronisation d’affichage personnalisés.
1280×800 (16:10, WXGA) — L'outil de travail principal des armoires IHM
Les 80 pixels verticaux supplémentaires qui séparent le 1280×800 du 720p se traduisent directement par une flexibilité de mise en page que les développeurs de logiciels IHM décrivent systématiquement comme significative. Format d'image 16:10 Le format 16:9, plus proche d'une feuille de papier standard que le 16:9, est traditionnellement utilisé dans la conception de logiciels industriels. De nombreuses plateformes SCADA, environnements de programmation d'automates programmables et interfaces de contrôle de processus ont été conçus à l'origine pour ce format. Leur utilisation sur des écrans 16:9 impose des opérations de recadrage ou de défilement qui réduisent l'efficacité opérationnelle.
L'avantage pratique : une disposition 1280 × 800 permet d'intégrer une rangée supplémentaire de boutons programmables en bas d'un écran IHM standard, sans masquer le graphique de tendance ni la barre d'état situés au-dessus. Pour les interfaces CNC, les systèmes d'automatisation des bâtiments et les écrans de dispositifs médicaux, où chaque pixel vertical est dédié à une fonction précise, cet avantage est crucial pour le bon fonctionnement de l'appareil, et pas seulement pour son esthétique.
1920×1080 (16:9, Full HD) — La norme de visualisation SCADA
La Full HD est la résolution de prédilection lorsque la densité d'informations et la fidélité des pixels sont prioritaires et que la taille de l'écran permet un confort visuel optimal. Sur un écran de 21,5 pouces, la résolution 1920 × 1080 offre environ 102 ppp, ce qui convient à une lecture à bout de bras. Sur un écran de 15,6 pouces, la même résolution atteint environ 141 ppp, permettant un rendu précis des détails, essentiel pour les stations d'inspection visuelle, les écrans d'imagerie médicale et les affichages de contrôle de processus multicanaux.
L'adoption croissante de l'inspection visuelle assistée par l'IA dans l'industrie 4.0 stimule la demande d'écrans FHD dans ce secteur : les interfaces de vision industrielle qui affichent en temps réel les flux vidéo des caméras avec des cadres de délimitation des défauts, des scores de confiance et des étiquettes de classification nécessitent une résolution FHD optimale pour rester lisibles dans les environnements de production à cadence élevée. Selon les données d'adoption de l'industrie de l'affichage, les écrans FHD représentent désormais plus de 55 % des nouveaux déploiements de moniteurs industriels de plus de 15 pouces dans les usines de fabrication avancée, contre environ 38 % en 2020.
Le véritable coût d'une inadéquation de résolution
Une incompatibilité de résolution ne se limite pas à créer des artefacts visuels ; elle engendre une perte de temps d'ingénierie qui s'accumule tout au long d'un projet. Les intégrateurs de systèmes d'automatisation indiquent consacrer en moyenne… 8 à 12 heures d'ingénierie par projet Résolution des problèmes de mise à l'échelle de l'interface utilisateur lorsque la résolution native d'un écran entre en conflit avec le signal de sortie du système hôte. La mise à l'échelle d'un signal 1080p sur un écran 1280×800 introduit un crénelage dans le rendu du texte — un désagrément mineur pour un utilisateur lambda, mais un véritable problème de lisibilité lorsqu'un opérateur lit des codes d'alarme sous pression temporelle.
Sur une série de production de 50 unités ou plus, les retouches liées à l'affichage (modifications du firmware, mises à jour des pilotes, remplacement physique de la dalle) représentent généralement : 6 à 9 % du coût total d'installation des panneaux IHM sur des lignes complexes. Il s'agit d'une surcharge évitable lorsque la résolution est adaptée à la sortie logicielle dès la phase de spécification.
Deuxième point — Résilience environnementale
La résolution détermine ce que vous pouvez afficher. La robustesse environnementale détermine si l'écran peut afficher ces informations de manière fiable six mois ou six ans après son utilisation. C'est à ce niveau que l'écart entre les produits « commerciaux » et les produits « industriels » devient financièrement significatif.
Luminosité et lisibilité en plein soleil — La formule Nits
Les écrans grand public standard fonctionnent à une luminosité de 200 à 350 nits. Dans les environnements industriels à forte luminosité ambiante, cette luminosité est insuffisante. Le critère technique qui détermine réellement la lisibilité est : Rapport de contraste effectif (ECR): ECR = (L_panel + L_reflect) / (L_black + L_reflect), où L_reflect = Lux ambiant × Réflectance / π.
Exemple pratique sur un quai de chargement couvert (éclairement ambiant de 8 000 lux, réflectance standard de 4 % pour un panneau brillant) : L_reflect = 8 000 × 0,04 / π ≈ 10² cd/m². Un panneau de 400 nits atteint un ECR ≈ (400 + 10²) / (0,5 + 10²) ≈ 4.9:1 — en dessous du seuil de lisibilité pratique de 5:1. Panneau de 1 000 nits dans les mêmes conditions : ECR ≈ 10.9:1 — parfaitement lisibles. C’est pourquoi le seuil industriel pour une utilisation en extérieur est fixé à 800 nits minimum, les environnements exigeants nécessitant 1 000 nits ou plus.
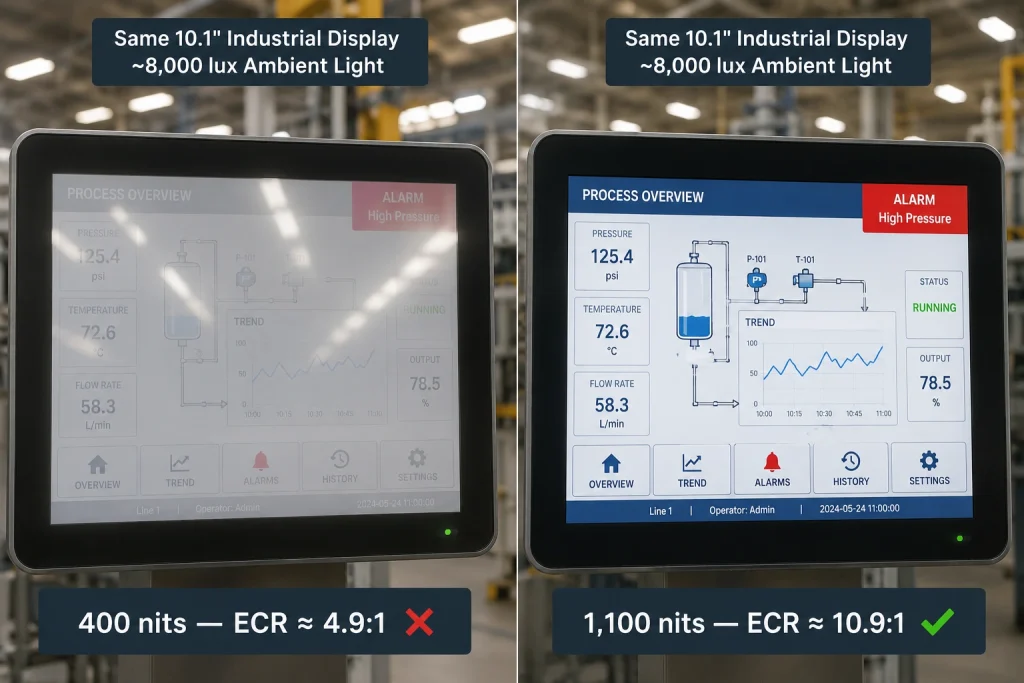
Affichage de Kadi’ s Écran industriel lisible en plein soleil de 10,1 pouces et de résolution 1280×720 atteint 1 100 nits grâce à un réglage de la luminosité contrôlé par DDC, une conception à faible CEM et une entrée HDMI/DP via une carte pilote RTD2555T intégrée — une combinaison de spécifications qui répond à la fois aux exigences de luminosité et aux exigences de compatibilité d'intégration pour cette taille de panneau.
Plage de températures de fonctionnement — Seuil de température étendu
Les écrans LCD standard sont conçus pour fonctionner entre 0 °C et 50 °C. Les écrans industriels à large plage de températures étendent cette plage de −20 °C à +70 °C, certaines versions étant même conçues pour un stockage à −30 °C et un fonctionnement à −20 °C. L'intérêt financier de ces écrans se manifeste clairement dans certains contextes d'utilisation.
Dans une usine agroalimentaire où les zones de production sont soumises à des cycles de température inférieure à 5 °C pour des raisons de désinfection, puis ramenées à leur température de fonctionnement, les contraintes thermiques sont telles qu'un écran professionnel n'a jamais été conçu pour les supporter. La condensation et la dérive des capteurs tactiles capacitifs, causées par ces cycles thermiques autour du point de rosée, peuvent rendre un écran professionnel inutilisable en quelques semaines. Les écrans à large plage de températures utilisent des formulations de fluide LCD et un micrologiciel de contrôleur modifiés qui garantissent des taux de rafraîchissement et une géométrie d'image stables malgré ces variations de température.
Pour les applications industrielles embarquées et intégrées aux véhicules — machines agricoles, équipements miniers, engins de chantier —, La spécification d'une large plage de températures est une exigence de base, et non une option.Les conceptions qui considèrent cela comme une mise à niveau découvrent la différence de coût dès la première panne au démarrage à froid sur le terrain.
Technologie tactile et indice de protection IP
Les environnements industriels génèrent des contaminations. Les brouillards de liquide de refroidissement, les particules métalliques, les produits chimiques de nettoyage et les gants des opérateurs interagissent avec les surfaces d'affichage d'une manière pour laquelle les écrans tactiles grand public n'ont jamais été conçus. Le choix entre les couches tactiles résistives et capacitives projetées (PCAP/CTP) a des conséquences opérationnelles concrètes :
Affichage de Kadi’ s Écran LCD TFT industriel 10,1 pouces 1280×800 avec technologie tactile capacitive (CTP) démontre un équilibre pratique : technologie de dalle IPS pour de larges angles de vision, traitement de surface antireflet et couche CTP optimisée pour une utilisation industrielle où la taille minimale de la zone tactile pour une utilisation avec des gants est généralement spécifiée à 10 mm.
Troisième point — Compatibilité d'intégration système
Un écran performant individuellement peut devenir un véritable projet d'intégration si son interface de signal n'est pas compatible avec la plateforme hôte. Ce point est souvent négligé lors de l'achat, car les fiches techniques mettent généralement en avant les spécifications optiques tout en reléguant les détails d'interface en dernière page.
Normes d'interface de signal — Quatre voies, non interchangeables
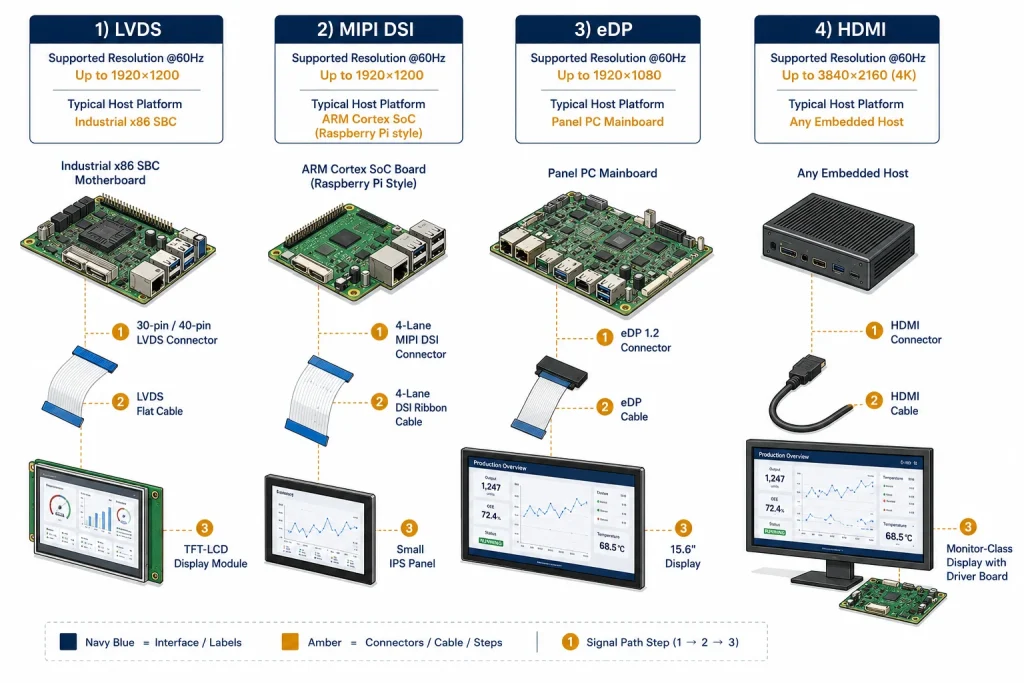
Le secteur de l'affichage industriel utilise quatre normes de signal principales. Elles ne sont pas interchangeables sans conversion matérielle, et chacune a des implications spécifiques sur les combinaisons de résolution et de taille de panneau qu'elle peut prendre en charge à 60 Hz :
Considérations relatives aux pilotes du système d'exploitation et à l'approvisionnement à long terme
Au-delà de l'interface de signal, la compatibilité de la carte de pilotage d'affichage avec le système d'exploitation cible est un facteur d'intégration essentiel. Les plateformes industrielles Linux utilisant Yocto, Buildroot ou Ubuntu pour systèmes embarqués nécessitent la prise en charge des pilotes d'affichage au niveau du noyau. Pour les moniteurs connectés en HDMI, cette opération est généralement simple. En revanche, pour les écrans MIPI DSI sur des plateformes SoC personnalisées, une configuration supplémentaire de l'arbre de périphériques, spécifique au modèle d'écran, est souvent nécessaire ; cette étape de configuration peut rallonger considérablement le délai de mise en service si elle n'est pas prévue au préalable.
Liste de contrôle pratique des spécifications pour la compatibilité d'intégration :
- Prise en charge confirmée du pilote noyau pour la version et la build du système d'exploitation cible
- Disponibilité de matériel de référence (kit d'évaluation ou plateforme fonctionnelle connue)
- Délai de production aligné sur le calendrier du projet
- Engagement d'approvisionnement minimum déclaré par le fabricant (essentiel pour les cycles de vie des produits de 7 à 10 ans)
- Flexibilité OEM/ODM si l'intégration du module d'affichage nécessite une personnalisation mécanique
Le dernier point mérite d'être souligné. Un produit industriel conçu pour une durée de vie de 7 ans nécessite un écran bénéficiant d'une continuité d'approvisionnement équivalente. Un écran arrivant en fin de vie au bout de trois ans impose une refonte : le boîtier mécanique et les données d'étalonnage logiciel liées au profil colorimétrique d'origine peuvent nécessiter une mise à jour. Les fabricants disposant de gammes de produits industriels dédiées et de programmes d'approvisionnement à long terme, tels que… La gamme d'écrans LCD TFT industriels de Kadi Display avec support OEM/ODM, offrent une base de planification de la chaîne d'approvisionnement plus fiable que les alternatives axées sur le consommateur.
Mise en application des trois solutions à des cas d'utilisation industriels réels
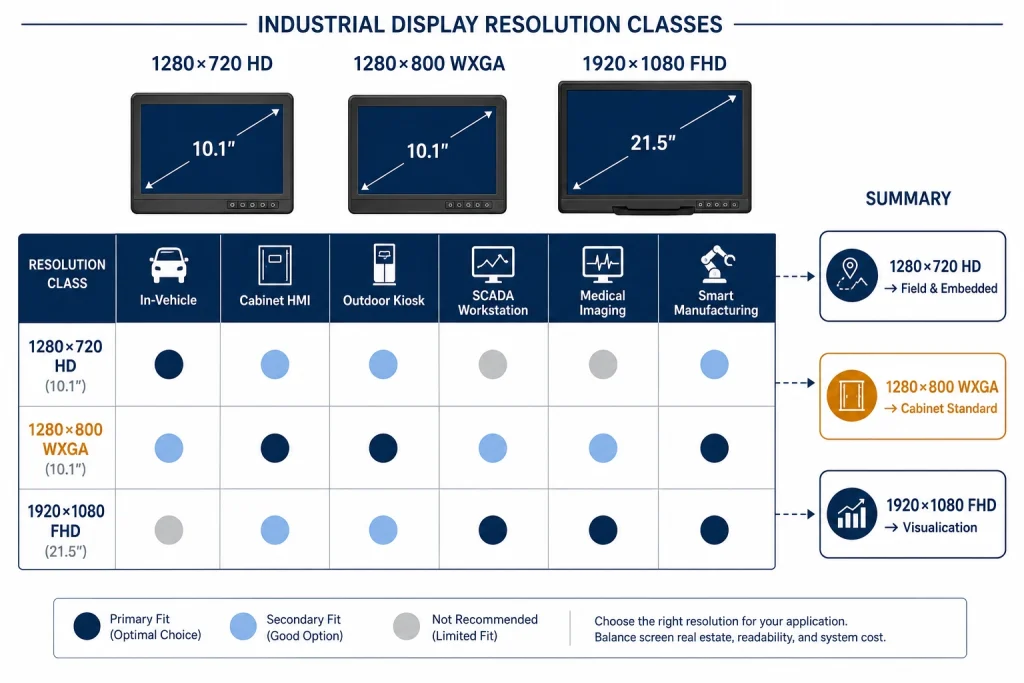
En considérant les trois points clés du Triangle d'or, la correspondance entre résolution et application devient simple pour la plupart des scénarios de déploiement. Le tableau ci-dessous présente les six catégories d'applications d'affichage industriel les plus courantes, avec un niveau de détail technique :
Exemples concrets de l'ECR et de l'environnement
Le tableau suivant applique la formule ECR à huit scénarios de déploiement réels, indiquant la classe de résolution appropriée et l'influence des paramètres environnementaux sur le résultat de la spécification. Les valeurs ECR marquées d'un ✔ dépassent le seuil de lisibilité pratique de 5:1 ; celles marquées d'un ✗ sont inférieures.
Formule ECR : (Nitaux du panneau + L_reflect) / (Niveau de noir du panneau + L_reflect). L_reflect = Lux ambiant × Réflectance / π. Niveau de noir du panneau supposé : 0,2 cd/m². AG = revêtement antireflet.
Trois études de cas — Le triangle d'or en pratique
Terminal embarqué compact pour machines agricoles (1280×720)
Un fabricant de matériel agricole de précision recherchait un terminal opérateur pour cabine de tracteur. Contraintes environnementales : plage de températures de fonctionnement de -25 °C à +70 °C, vibrations conformes à la norme IEC 60068-2-64, éclairement intérieur maximal de 12 000 lux à travers le pare-brise. Le cahier des charges initial prévoyait un écran FHD de 10,1 pouces, partant du principe qu’une résolution plus élevée est préférable. Le coût de l’option FHD à 10,1 pouces est environ 40 % supérieur à celui des écrans 1280 × 720, sans avantage visible en termes de densité de pixels pour un opérateur assis à 50–70 cm de l’écran (les deux résolutions étant largement supérieures à la limite d’acuité visuelle à cette distance).
Spécifications finales : écran 10,1 pouces, 1280 × 720, 1 100 nits, IPS, large plage de températures, interface LVDS, tactile résistif (utilisation avec gants recommandée). Éclairement équivalent (ECR) à 12 000 lux (cas le plus défavorable), revêtement AG à 1,5 % : ≈ 21:1. Certification large plage de températures : démarrage à froid vérifié à −20 °C. Économies sur la nomenclature par rapport à l’option FHD : environ 38 $ par unité. Sur une production annuelle de 500 unités, cette différence est significative et a un impact direct sur la marge produit.
Armoire IHM : Contrôleur d’automatisation du bâtiment (1280×800)
Un intégrateur de systèmes de gestion technique du bâtiment a standardisé sa gamme de contrôleurs d'ambiance sur des écrans de 10,1 pouces. La plateforme logicielle, une interface SCADA commerciale initialement conçue pour une résolution de 1280 × 800, nécessitait un affichage au format 16:9 avec bandes noires, ce qui supprimait une rangée complète de boutons de navigation et imposait une refonte de l'interface utilisateur. Le fournisseur du logiciel estimait le délai de développement à 3-4 semaines.
Résolution : 1280 × 800, compatible avec la mise en page native du logiciel, éliminant ainsi toute nécessité de refonte. Environnement : intérieur contrôlé, luminosité ambiante de 300 à 800 lux, température de 15 à 40 °C. Surface tactile : PCAP antireflet, boutons d’une distance minimale de 10 mm pour une utilisation du bout des doigts. Interface : LVDS vers une plateforme embarquée x86 existante. Temps total d’intégration de l’interface utilisateur : 4 heures (configuration du pilote uniquement). Les 3 à 4 semaines de développement logiciel économisées ont permis un gain de temps sur le calendrier du projet supérieur au coût total d’acquisition de l’écran.
Visualisation SCADA : Station d’épuration des eaux (1920×1080)
Un service des eaux a modernisé les postes de travail des opérateurs dans une station d'épuration. La plateforme SCADA affichait simultanément les données en temps réel de 48 points de traitement, avec des alertes, des graphiques de tendances et une visualisation du réseau de canalisations. À une résolution de 1280 × 800, les opérateurs ont signalé que la densité d'affichage combinée nécessitait de faire défiler l'écran pour naviguer entre les zones ; un problème d'ergonomie devenu un risque pour la sécurité lors des alarmes, lorsqu'une navigation rapide entre les zones était indispensable.
Spécifications : Écran IPS 21,5 pouces, 1920 × 1080, 400 nits (environnement intérieur contrôlé, luminosité ambiante confirmée < 600 lux), interface eDP pour PC industriel. À cette résolution et avec cette taille d’écran, les 48 points de processus étaient visibles simultanément sans défilement. Retour d’expérience des opérateurs après déploiement : le temps de navigation pour la prise en compte des alarmes inter-zones a été réduit d’environ 35 %. L’investissement dans l’écran FHD a généré un gain d’efficacité opérationnelle mesurable dès le premier mois de déploiement.
Liste de vérification pour la décision de sélection — Six questions
La liste de contrôle structurée suivante applique le cadre du Triangle d'or à tout scénario de déploiement spécifique. Suivez les étapes dans l'ordre : les réponses précédentes influencent les suivantes.
Résumé — Le triangle tient
Les résolutions (1280×720, 1280×800, 1920×1080) ne sont qu'un point de départ, et non la décision elle-même. Les ingénieurs qui s'arrêtent à la résolution et négligent la robustesse environnementale se retrouvent avec des écrans défaillants sur le terrain. Ceux qui maîtrisent les spécifications environnementales mais négligent la compatibilité d'intégration passent des semaines à déboguer les pilotes et les chaînes de signaux. Et ceux qui se concentrent uniquement sur l'intégration, en sous-estimant la luminosité ou la plage de températures, constatent, quelques mois plus tard, que l'écran est illisible ou fonctionne de manière erratique.
Le Triangle d'Or est pertinent car ses trois sommets sont véritablement interdépendants. Un écran de 10,1 pouces (1280 × 720 pixels) d'une luminosité de 1 100 nits, fonctionnant sur une large plage de températures et doté d'une carte de pilotage HDMI, résout un problème totalement différent de celui d'un écran IPS de 21,5 pouces (1920 × 1080 pixels) avec interface eDP. Aucun n'est universellement supérieur. Chacun peut être parfaitement adapté – ou totalement inadapté – selon la configuration du triangle pour chaque cas particulier.
L'acquisition d'écrans industriels est un problème d'ingénierie qui se présente comme une décision d'achat. La formule ECR, la plage de températures, la fiche technique de l'interface : ce sont les outils qui permettent de prendre une décision d'ingénierie plutôt que de se fier à une supposition.
Clause de non-responsabilité: Les valeurs du rapport de contraste effectif (ECR) utilisent un modèle de réflexion lambertien simplifié à des fins d'illustration. L'ECR réel dépend des caractéristiques d'émission angulaire du panneau, de la géométrie du verre de protection, de l'uniformité du traitement de surface et de l'angle de vision. Les valeurs d'éclairement ambiant sont des plages représentatives issues de données de référence générales. Toutes les spécifications et durées de vie indiquées sont des valeurs indicatives conformes aux normes industrielles. Veuillez vérifier toutes les spécifications auprès de votre fournisseur de panneaux avant utilisation. finalisation Tout design est présenté ci-dessous. Les marques et noms de produits appartiennent à leurs propriétaires respectifs. Aucune affiliation avec les fabricants tiers n'est sous-entendue.
Précédent
Même « haute luminosité », ingénierie différente : en quoi les circuits de rétroéclairage LCD de 1 000 et 2 000 nits diffèrent-ils réellement ?
Suivant
Test ultime en extérieur : comment les écrans industriels de 2 000 nits triomphent des environnements extrêmes
Laisser un commentaire

Derniers blogs et nouvelles
- Industrial LCD EOL: What Happens from Pre-Announcement to Replacement Mass Production?
- Electronic Component Obsolescence Management for Industrial Displays: An OEM Guide
- How to Develop a Production Ready Custom Display Assembly TFT Module Touch Cover Glass FPC Bonding and Mounting
- 15 Pin vs 22 Pin Raspberry Pi DSI Connectors Cable Pinout and Compatibility
- Native MIPI DSI vs LVDS or HDMI Bridge: An OEM Display Architecture Decision Guide